Test
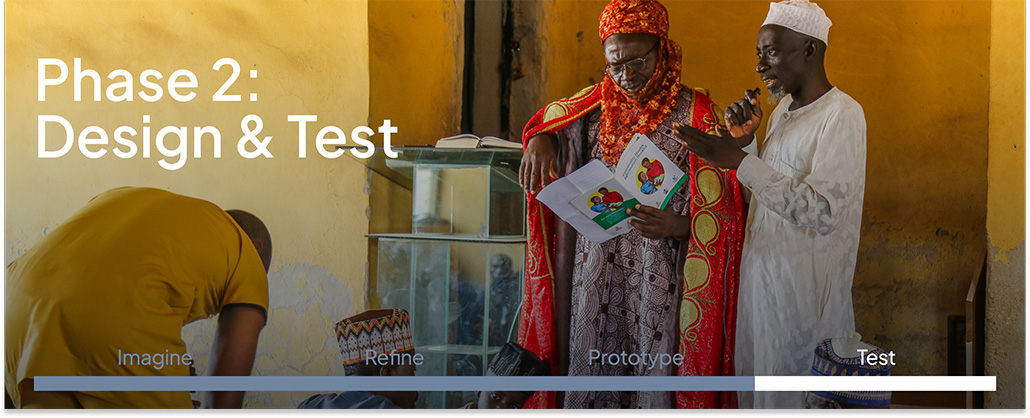
Nigeria, Design & Test
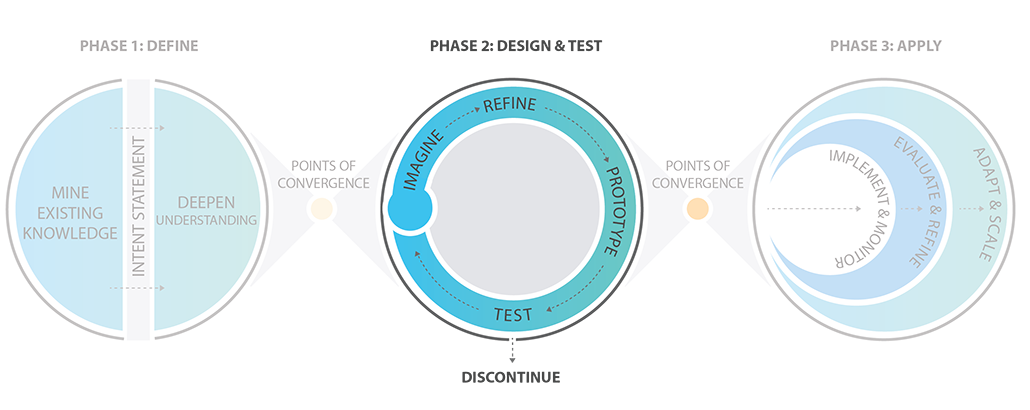
During the Design & Test Phase, Flow Chart users translate problems into solutions using a highly creative, collaborative, energetic, and human-centered approach. Using the insights and opportunities identified during the Define Phase as inspiration, groups of designers, health experts, development specialists, stakeholders, and representatives from the audience come together to rapidly generate a broad array of ideas for possible solutions. Users iteratively refine, prototype, and test these ideas several times in increasing levels of fidelity, using user feedback to inform the final solutions and ensure that they are both useful and usable for those involved in the design.
Test
How do we know if our ideas work well?
By the end of this step, you will have an understanding of when to continue return to the Design and Test Phase, when to discontinue, or when to move to the Apply Phase. You will have a solution or set of solutions ready for the apply phase.
How to conduct this step and achieve its main objectives:
Test Prototypes
The rough prototype mock-ups are tested with communities or target audiences. Through this process, your team will rapidly iterate and further refine prototypes based on the audience’s feedback, co-creating successful solutions.
Testing Checklist
Suggested time:
1–2 hours
Participants:
Design and research team, partners, and
stakeholders
Tool: Testing Checklist
A testing checklist is a structured document that outlines essential steps for evaluating products, services, messages, or processes. It serves as a comprehensive guide for quality assurance, ensuring thorough examination of all aspects of a system.
Effort required:

Gather Feedback
After each testing sprint you want to gather feedback from your audience. This feedback will inform the steps you take and guide the conversion of testing feedback into implementation recommendations. To expedite the process, you can conduct synthesis sessions along the way with your team.
Gathering People’s Feedback
Suggested time:
5–6 hours, depending on scope
Participants:
Design and research team, partners and
stakeholders, individuals you are designing
for
Tool: Gathering People’s Feedback
This tool provides the most relevant points to have in mind when collecting feedback from your users during testing.
Effort required:

Prioritize Solutions
The next step is to prioritize the solutions you need to make based on the feedback. Focus on the most impactful things that demand less effort from your team. You want solutions that will improve the user experience and solve the problem.
Integrate Feedback, Iterate, and Prioritize
Suggested time:
5–6 hours, depending on scope
Participants:
Design and research team
Tool: Integrate Feedback, Iterate, and Prioritize
The impact effort matrix is a potent decision tool that evaluates ideas by weighing their potential impact against the effort needed for execution. By mapping ideas on a grid, you will be able to prioritize solutions: those with high impact and low effort become quick wins, while high-impact, high-effort initiatives require strategic planning for efficient resource allocation and decision making.
Effort required: